For EE 354: Introduction to Digital Circuits, my lab partner and I built an aiming practice game using the Nexys 4 and its built-in Analog ADXL362 accelerometer.
Abstract
Firing Frenzy is inspired by the aim test on the human benchmark website, where targets appear one by one and the user must “click” on a certain number of targets as fast as possible. Users will utilize the Nexys 4’s Analog ADXL362 accelerometer to aim the cursor and the Up button to click on targets. The main goal of the project was to learn about how to utilize the different protocols of the Nexys 4 to retrieve and parse through analog data.
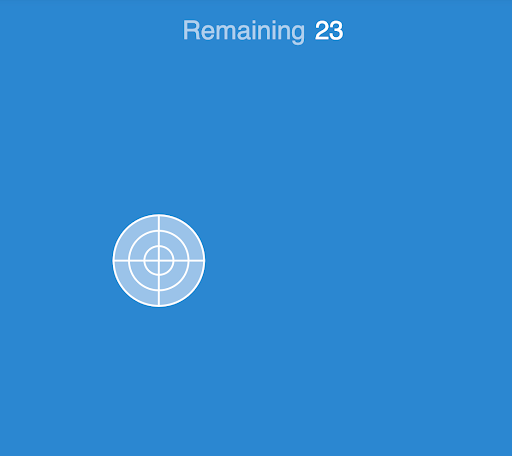 Figure 1. Inspiration for the project
Introduction and Background
Previous labs that were helpful included the Detour, Divider, and GCD labs, which taught us how to properly code and utilize SSDs, as well as debounce buttons. Other resources and manuals were referenced to understand the accelerometer and its SPI protocol:
The Design
(A) Design description of your implementation
Our project has 4 main modules:
spi_controller.vdisplay_controller.vcolor_controller.vfiring_frenzy_top.v
SPI Controller:
The spi_controller.v file handles sending instruction data to the Nexys 4 and retrieving the accelerometer data using the SPI protocol. The inputs of this module includes a 4MHz clock, the master in slave out signal (MISO). The module outputs the master out slave in signal (MOSI), channel select bit, and a 1MHz SCLK to the Nexys 4 accelerometer. The SPI protocol has a master-to-slave relationship similar to I2C. The MISO and MOSI connect to all slaves and the chip select line allows the master to decide which slave to work with. Since our project only has one slave, chip select will be set to 0 when reading.
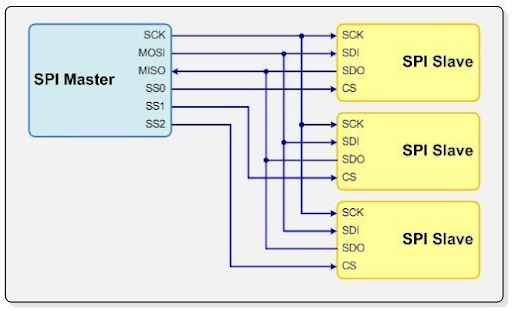 Figure 2. Master-to-slave relationship
The process of retrieving accelerometer data is explained further in the state machine section of the report.
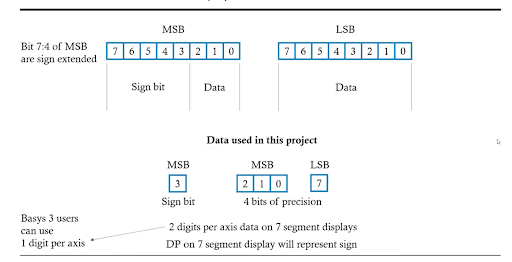 Figure 3. Accelerometer data format
The accelerometer returns data in a two’s complement format with 11 bits of precision and one sign bit, with bits 7 through 4 of the MSB as extensions of the sign bit. This module outputs the accelerometer magnitude and the signs (+/-) of the X-, Y-, and Z-axis separately to be used by other modules for processing.
Display Controller:
The display_controller.v file handles our VGA output. This file is taken from the starter code provided by TA.
Color Controller:
The color_controller.v file handles which colors each pixel on the display should have. The main inputs of this module are a 12-bit RGB array, the accelerometer data, and the current score.
The accelerometer data is processed in this module. As mentioned in the SPI controller section, the data is received in a 12-bit two’s complement model. Thus each axis receives data in the range between 1024→0→-2048→-1024, where 0 or -2048 is read when the board is laying flat. Each half of the axis then is in a range between 0→1024, and a slope equation can be generated for each half-axis to convert the data to coordinates.
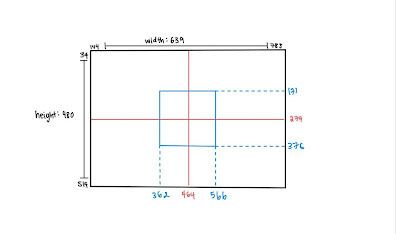 Figure 4. Screen and Target Coordinates
The Nexys 4 documentation indicates that the accelerometer is turned 90 degrees on the board; thus, the Y-axis accelerometer corresponds with the X-axis of the screen. For example, when the board is tilted to the right, the data received can be in the range of -2048→-1024 on the Y-axis. Based on the data above in the figure, we can generate the equation xposition=464+102048−ydata, where ydata is the magnitude of the Y-axis data. This equation returns xposition=0 when ydata=2048 and xposition=566 when ydata=1024. The resulting coordinates are then assigned to a wire.
An always block handles the states and transitions of the state machines, which will be addressed in the next section. The RGB values of the cursor, firing area, and target are updated in a separate always block, which updates the VGA signals in the top module.
Top Controller:
The firing_frenzy_top.v calls all our modules and passes necessary variables between modules and the Nexys 4. The top controller also handles displaying the number of targets remaining to hit on the SSD using the decimal-to-SSD converter written in previous labs.
(B) Explanation of the state machine
The project consisted of two state machines: one for the accelerometer and one for the controls. Both state machines were Mealy machines whose state transitions were independent of each other.
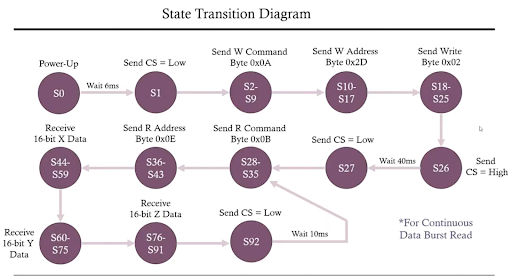 Figure 5. State diagram for getting data from accelerometer
The code for the accelerometer state diagram can be found in the spi_controller.v file. Since only one byte of data can be sent and received at a time, the state machine in the code involves 92 states, but a simplified version is demonstrated above.
- In the power up state (S0), the clock stays idle for 6ms in order for the accelerometer to be reached to standby mode.
- In the begin state (S1), the chip select line is set to 0 and the clock is set to idle. The next 8 states activate the clock and then send the write command (
0x0A) using the MOSI output one bit at a time.
- The next 8 states (S2-S9) send the register address that the accelerometer must write to (
0x0D).
- The next 8 states (S10-S17) set the accelerometer to measurement mode by sending the byte
0x02.
- In the wait state (S26), the chip select is then disabled and waits for 40ms in order for data to first be received.
- The next 9 states (S27-S35) enable the chip select bit and send the read command to the accelerometer (
0x0B).
- The next 8 states (S36-S43) send the register address that the SPI master must read from to (
0x0D).
- The next 48 states (S44-S91) involve reading the X-, Y-, and Z-data individually.
- The last state (S92) involves waiting for another 10ms before reactivating the chip select and returning to state 28.
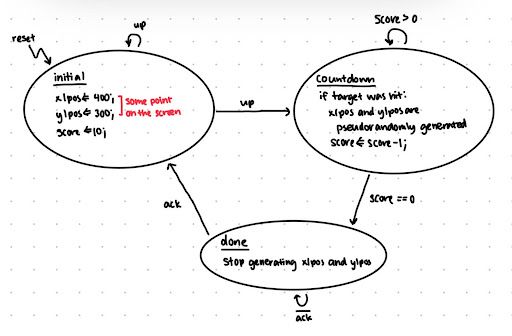 Figure 6. State diagram for the controls
The controls were based on two buttons: the Up button — used to aim for targets — and the Center button — used for resetting. Upon reset, the state machine starts at the initial state, where it sets the first target’s location pseudorandomly based on the current coordinates of the cursor using a linear feedback shift register (LFSR). Valid X- and Y-coordinates for the target were [340, 580] and [160, 380], respectively.
In the current game mode, the user has an unlimited period of time to hit 10 targets, so the initial state also sets a score variable to 10. Any number can be chosen, so long as the score is greater than 0.
The first time the Up button is hit, the state machine moves to the countdown state. In this state, when the button is pressed, the overlap between the target’s X- and Y-coordinates and the accelerometer’s X- and Y-coordinates are checked. If they match, it means the hit was successful and a new target location is generated using LFSR. The score is decremented by one as a result. If the accelerometer totally misses the target, then nothing is updated. The design of the project gives no penalty to misses; the user just has to hit the right target eventually for the state machine to proceed.
Eventually, the score will hit 0 — meaning the user has correctly hit 10 targets. At this point, the state machine transitions to the done state, where the target disappears, but the accelerometer pointer remains for the user to play with.
(C) User Interface:
The user interacts with our project through the accelerometer and pressing buttons. The accelerometer controls the placement of the cursor on the screen. Pressing the center button will cause the game to start, and pressing the up button will “fire” on the cursor.
Challenges
The main challenge we ran into was receiving data from the accelerometer and parsing that data into coordinates. Going through the documentation for the accelerometer and the Nexys 4 was very confusing. There were a lot of different clock cycles that needed to be generated between the SPI protocol and the accelerometer. However, once we had found some helpful resources online, it became much easier to determine how to get the data from the accelerometer and what format it came in. Originally, we didn’t have enough bits for the precision we were aiming for — originally we only had 3 bits of data and 1 sign bit — but after reading the documentation, we realized we had 11 bits of data and 1 sign bit available to us.
We also wanted to smooth out the cursor to make it less noisy. We knew this would be possible because in the Nexys4 default boot screen, the example accelerometer display has really smooth motion. In our project, the accelerometer has a noticeably jittery motion. After looking at the code for the Nexys4 default boot screen, it appears that they had averaged the last 16 accelerometer reads and displayed the average. We were not able to get this to work, likely due to some implementation differences between our code and theirs.
Test Methodology
Two methods were used to test our code:
- SSDs: We utilized SSDs as “live print statements” to output and verify certain values. For example, we output the raw X-, Y-, and Z-axis accelerometer data on two SSDs each to verify that we were correctly receiving the data. We had multiple debug configurations of SSDs. Another configuration enabled us to see live data and live processed coordinates of a given axis.
- Testbenches: We wrote a testbench to verify that our calculations were valid. Calculations such as our accelerometer to coordination data needed a test bench in order to debug and verify that the equations which converted data to coordinates were valid.
Conclusion and Future Work
This project has a lot of potential for additional player modes. Here are some suggestions:
- Multiple simultaneous targets on the screen that the user can hit in any order
- Timing modes — how many targets hit within a period of time, or limited time to hit a target
Moving targets
While the game seems simple, it can be quite fun! It’s also good practice for general hand-eye coordination, which is something that a lot of both casual and advanced gamers are always looking to improve.
In terms of the labs, oftentimes our group got stuck on some strange Verilog behaviors that were never fully explained in lecture or lab. One example that certainly comes to mind is the ordering of blocks, wires, and registers. Sometimes our code wouldn’t compile and the error messages weren’t clear on what the issue was, so we’d have to ask the TA or CP for help, only to realize it was a fairly simple solution that probably just should’ve been covered beforehand.
Some labs were also more helpful than others. I think we could have benefited from more time on the testbench lab and better explanations on the Picoblaze and Chipscope labs. The GCD lab, in comparison, was better documented so it was much easier to understand. It might also be beneficial to reconsider the ordering of some of the labs — we had testbenches show up super early, but it wasn’t until one of our final labs where we learned how to understand the parts of a testbench.